Increasing your AWS Expenditure by 200% in a week

This is a breakdown of how I once had to track down how our AWS costs increased by 200% in a week, without us rolling out any new services or deployments nor any increase in users.
tl;dr an AWS Read-Only Auditor role can have side-effects that cause you to spend a lot of money very quickly.
I was busy packing my bag for a holiday when I got a ping on the work slack. Something along the lines of “Does anyone know why our AWS costs are significantly higher across multiple accounts? We need to resolve this ASAP” along with this graph:
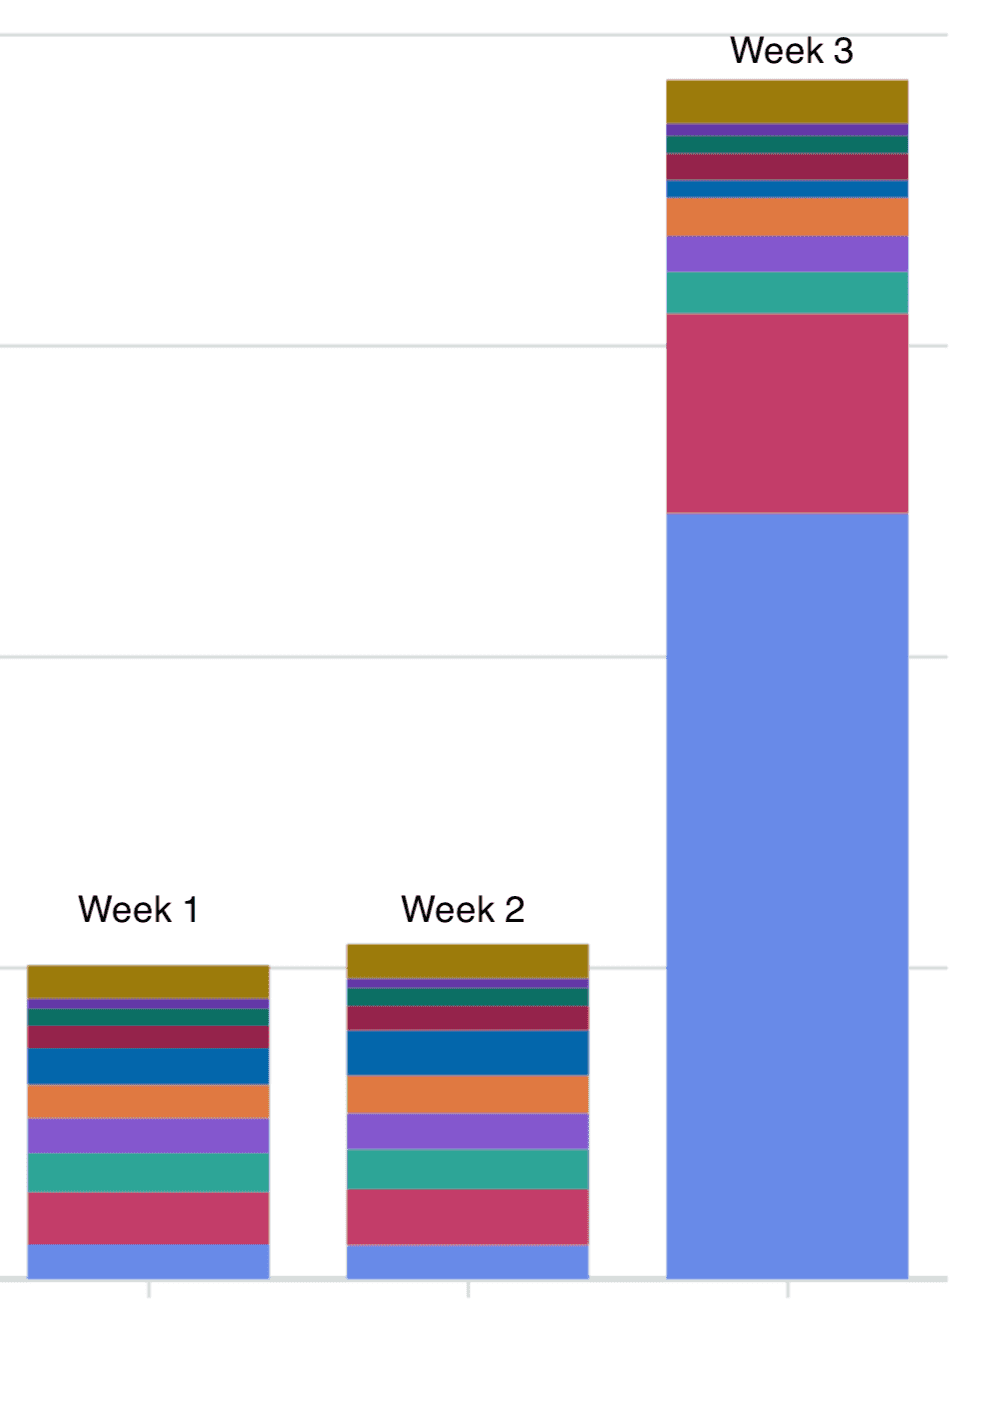
The first goal was to kill whatever was causing this spend as clearly something wasn’t right, only then would I try to fully understand the cause if it wasn’t clear by that point.
Stopping the Spending
This was where the biggest red herring arrived. When I did a breakdown by accounts in our organisation it was clear that one of our accounts, Account 4 was still sitting at the same expenditure as in previous months, so what was different there?
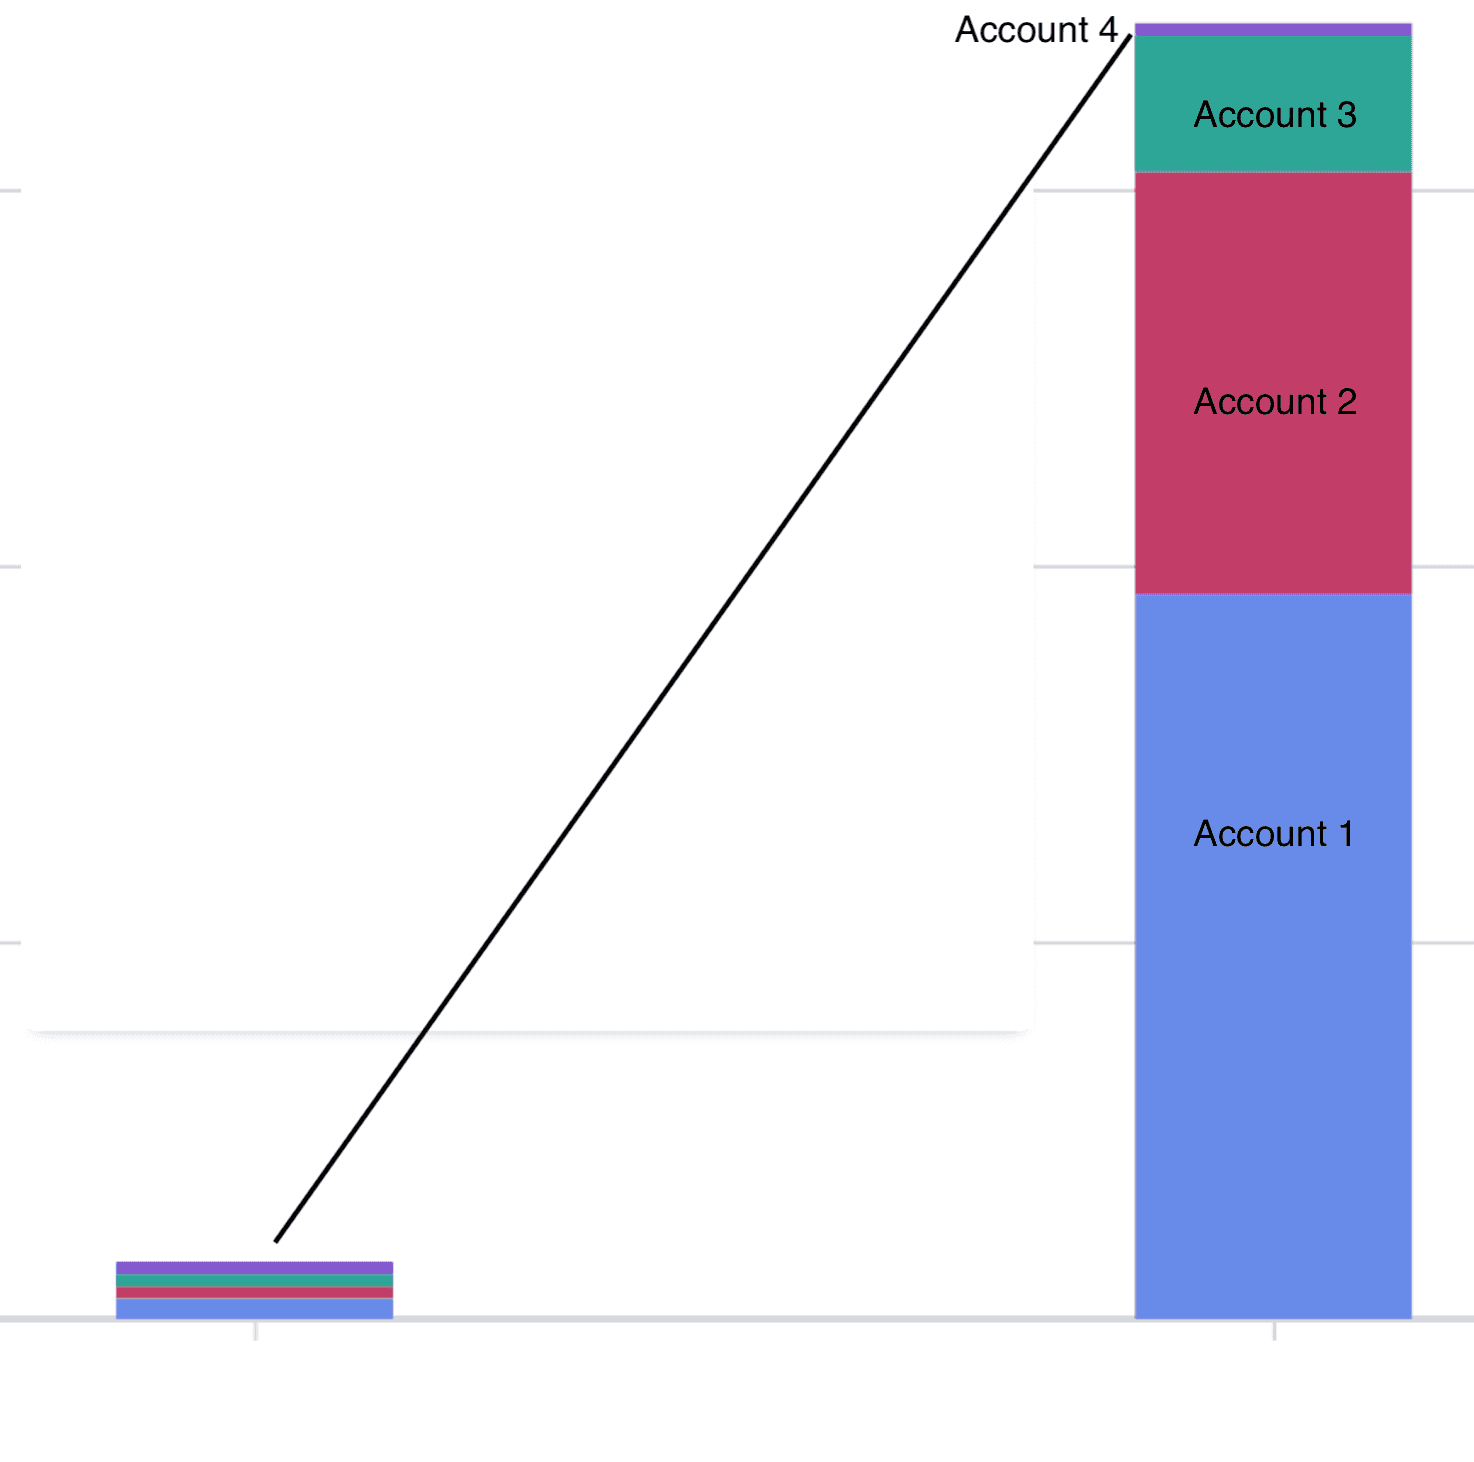
We’d recently started a trial of an infrastructure monitoring tool, but we hadn’t yet rolled it out to all AWS accounts in the organisation. Account 4 was the remaining account that hadn’t been enrolled into the new service yet. It matched, so the cause of our additional expenditure was the new tool, right? End of blog, standard misconfiguration of new tool…
So to verify this I looked at when the spike in costs began, it matched up perfectly with when I enabled the service following a meeting with their customer success team.
There was even a drop in costs around the time that we asked them to migrate our account to a different region.
I yoinked the permissions of the 3rd party service. Our spending stopped spiraling, I could take my holiday in peace.
Finding the cause
But when I returned things still didn’t add up, the expenditure was all for GetMetricData. The service we were trialing didn’t have permissions to call GetMetricData
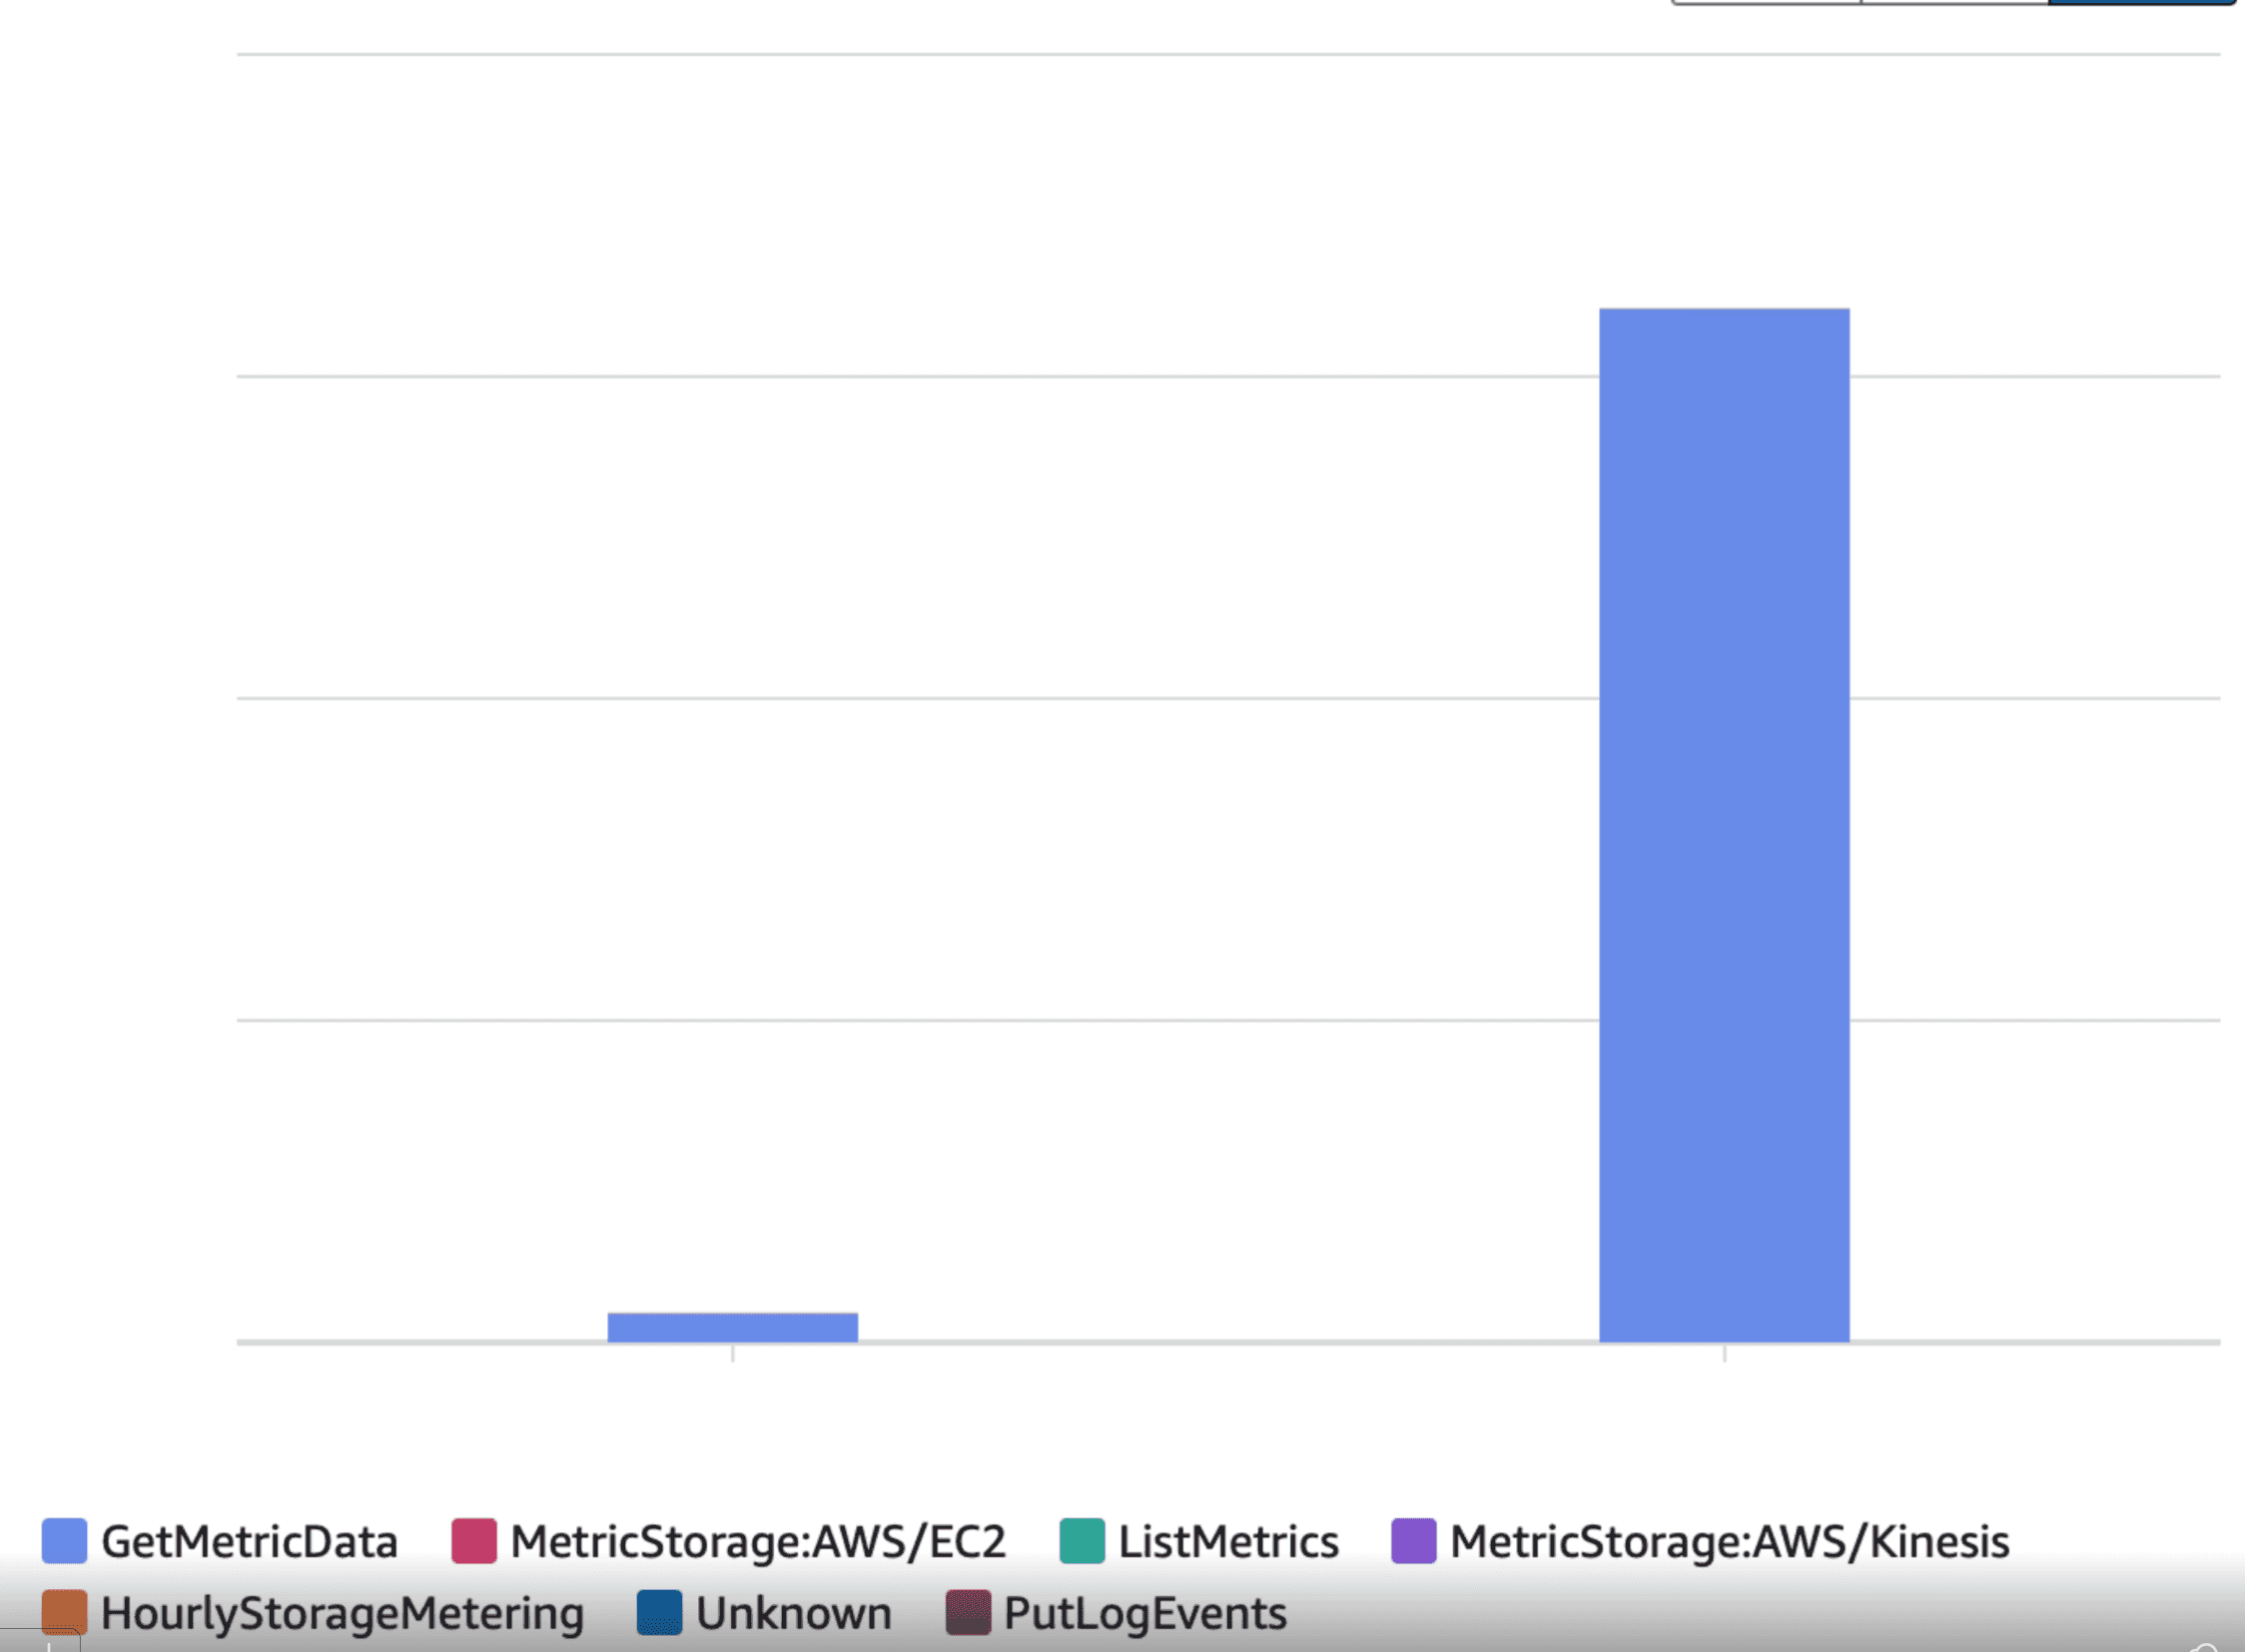
Yet when we removed the permissions that it did have; our spending stopped. How can a service be causing GetMetricData calls without having permissions to make them?
At least I thought that the spending stopped, but on closer inspection it carried on for 6 hours after I removed the permissions. If I reintroduced the permissions our spending would increase drastically almost instantly.
I needed a new angle of attack. The service is doing something that causes us to spend for 6 hours even after it’s disabled. GetMetricData doesn’t produce CloudTrail events, so there was no way to track where it was coming from. I looked back at how the spike affected our different accounts, this wasn’t just product accounts but also the organisation root account which is just used for SSO and budgets. The increase in each account also wasn’t on the same scale between accounts, it looked fairly random.
The trial service is running an inventory on our infrastructure, is there something that I can find in our accounts which matches up with the differences in scale of spending on each account?
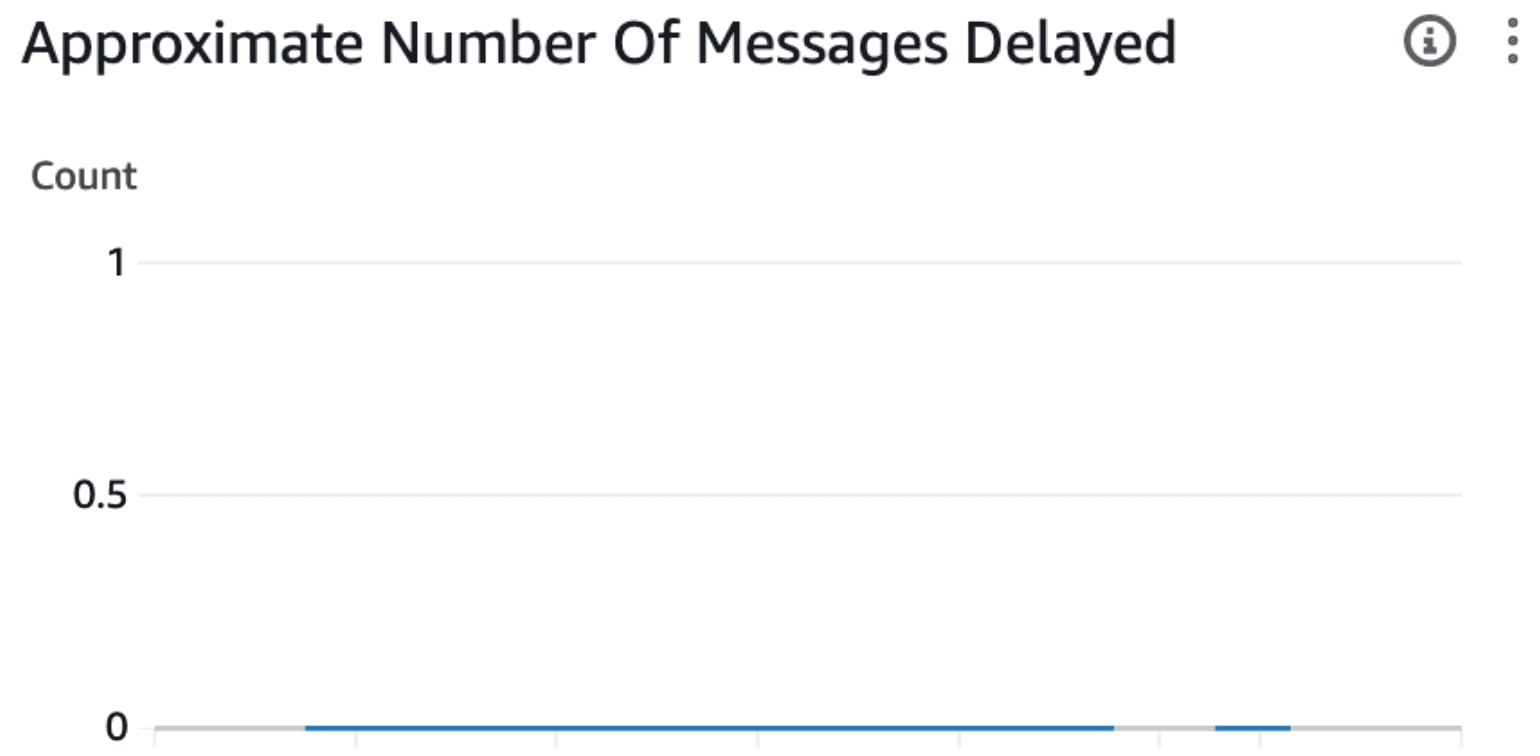
Looking at the metrics dashboard for each account I find these figures:
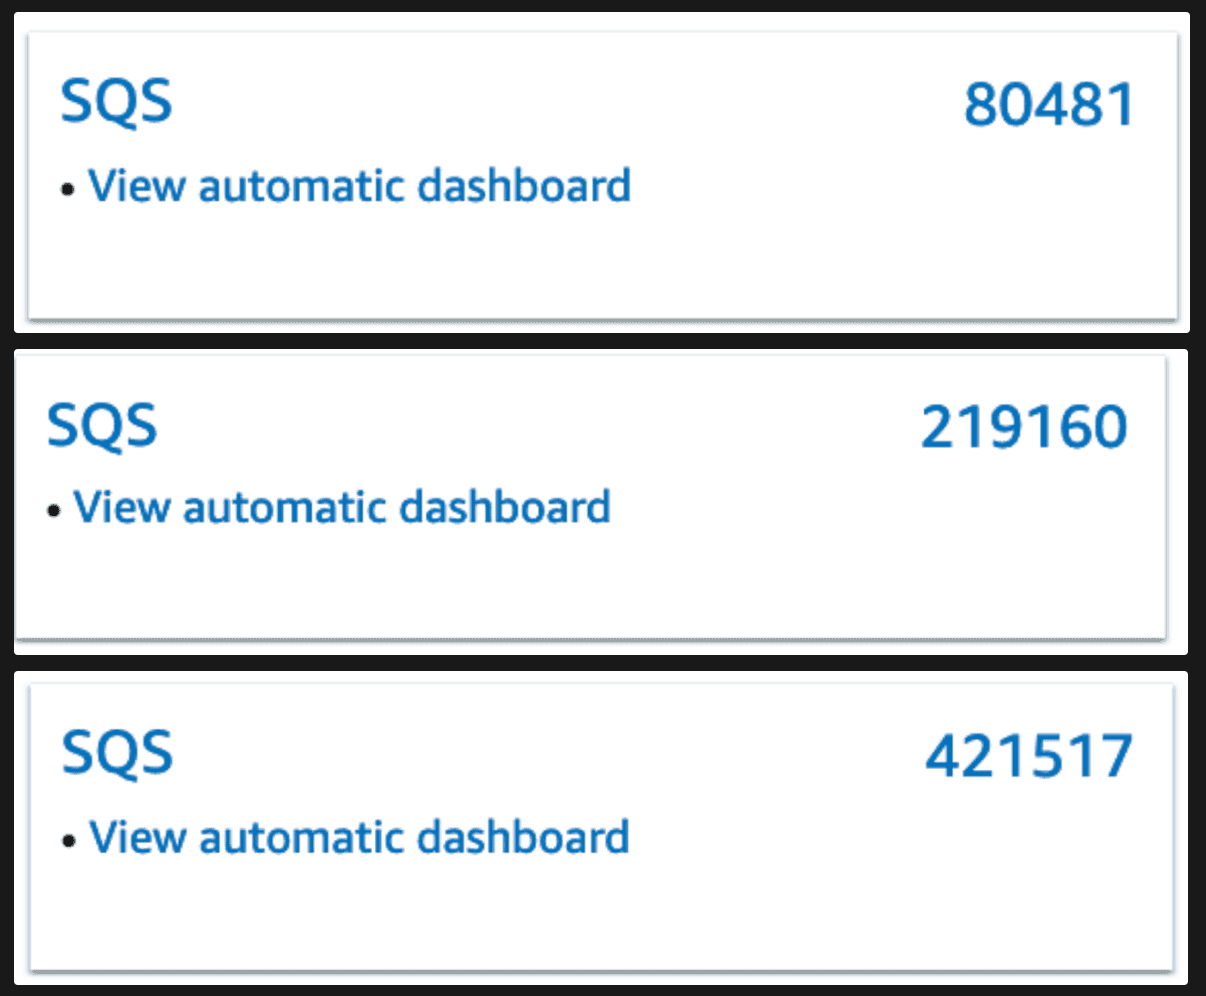
Well those ridiculously high numbers seem to match the scale of the increases across our accounts… So what the hell is going on here?
At one point in time we had an automated script which was running on our CI, a side-effect of that script was that multiple SQS queues were created and abandoned, but SQS queues are priced by requests, not by number of queues so this was not an issue and had been forgotten about. This affected our organisation root account because when the company was first using AWS it was our only account, so the script had been run there too in the early days.
But these queues had existed for years without causing us any problems, so we don’t actually have an answer yet… The service has been turned off for weeks, and now these metrics and queues are just sitting there not costing us anything.
So we know:
- The trial service doesn’t have access to get metrics
- There’s a 6 hour delay when we disable access before billing drops (but is this just a delay in how AWS calculates pricing?)
- We have a number of SQS queues & metrics that matches the scale of the expenditure increase
We also used a popular platform for logging & monitoring, which did have access to retrieve metric data. The permissions it had were quite lax in fact, with a GetMetricData:*.
I opened up Cloudwatch metric explorer, filtered down to an old SQS queue that wouldn’t have been queried in years and that’s when I saw a pattern that matched our billing, including the period of downtime of the service when they migrated our account to a new region.
Those are datapoints of 0 - before and after those 0s was ‘Missing data’, but those 0s are data points. Our logging and monitoring service was happily ignoring these metrics because they’d been sat there with No data for years, but now they had data! Wonderful zeros, across multiple metrics for a queue, and across hundreds of thousands of queues. When we turned on the infrastructure inventory these zeros would come flying in and in turn our bill would go up rapidly.
Understanding the cause
Zoning in now on these SQS queues being the cause, why are they suddenly reporting metric data?
I look through the AWS docs for SQS monitoring:
CloudWatch metrics for your Amazon SQS queues are automatically collected and pushed to CloudWatch at one-minute intervals. These metrics are gathered on all queues that meet the CloudWatch guidelines for being active. CloudWatch considers a queue to be active for up to six hours if it contains any messages, or if any action accesses it.
6 hours. Sounds familiar. I think I’ve found the culprit.
The service was making the SQS queues active. The queues reported metrics. The metrics were queried at great cost by our monitoring & logging tool.
Now is where I throw shade at AWS. Looking back at their documentation:
CloudWatch considers a queue to be active for up to six hours if it contains any messages, or if any action accesses it.
The tool we were using had an AWS managed service policy assigned to it. An Audit role, so it didn’t have the ability to access a queue, or put messages onto an SQS queue.
AWS considers an SQS queue to be active if an auditor accesses the metadata about said queue, not just the queue itself.
Follow-up
When we took this information to AWS they promptly refunded us, after we reconfigured our logging & monitoring system to be a bit less eager to track all of our metrics, as it was clear that we didn’t intend to produce this large influx of metrics.
Cover photo by Norbert Kowalczyk on Unsplash